
How to Turn Disconnected CSV Data Into an AI-Enhanced Relational Database (Teable) and Publish Interactive Widgets (Shareables)
If your organization has ever lost hours to messy spreadsheets, missing links, inconsistent categories, and duplicated effort, you are not alone. The common problem is not a lack of data. It is that the data lives in different places, uses different formats, and has relationships that are not formally connected. That is where AI-assisted data structuring becomes valuable.
In this guide, I explain a practical workflow for turning disconnected CSV files into a usable AI-enhanced relational database using Teable, then publishing an interactive, user-friendly widget powered by that structured data using Shareables. I also share what I learned while setting up real data and templates, including field mapping, image enrichment, and the most common integration gotchas.
Bottom line: You can replace “manual cleaning and linking” with an AI-assisted pipeline that organizes, enriches, and publishes your data as interactive content.
What this setup actually solves: the two big data pain points
Most teams hit the same two issues:
Disparate data: information is spread across Google Sheets, CSV exports, and separate tracking systems. There is no reliable way to connect them.
Disparate use: even after you clean a spreadsheet, it is hard to publish the information in a format that stays interactive and maintainable.
The approach described here addresses both:
Teable turns separate CSV datasets into a relational structure (tables and links) and can enrich fields with data automatically.
Shareables uses that structured dataset to generate an embeddable widget or page that supports browsing, filtering, and details views.
What matters is not the tool names. What matters is the pattern: connect data and then publish it through a UI layer that reflects your data model.
Who this is for
Content and knowledge teams who maintain tool libraries, resource directories, or program inventories and need an always-up-to-date interactive site.
Ops teams who need a consolidated view of records spread across multiple exports and sources.
Agencies and consultants building internal or limited-client knowledge bases (especially when you want to avoid hard-coding data into a website).
Nonprofits and mission-driven orgs who want data to support decision-making and reduce operational friction.
If your spreadsheet is “the system,” this workflow is designed to upgrade it into something closer to a real database plus an interactive presentation layer.
Core concepts: tables, relationships, and field mapping
To make the workflow succeed, you need three mental models.
1) Tables represent record types
Typical examples include:
Software (one row per tool)
Affiliate Programs (one row per program offer)
Purchases or Licenses (one row per purchase event)
Media (one row per video or asset tied to a tool)
2) Relationships replace “guessing”
In disconnected data across multiple CSV files, the link between records might only be implied through names or URLs. A relational structure formalizes relationships so queries and UI components behave predictably.
3) Field mapping determines what gets enriched and where it lands
Even if AI helps, you still need to decide:
Which columns should be used as identifiers (for example, a software name key)
Which missing fields should be filled (descriptions, categories, badges, image URLs)
Which fields should be ignored or left as-is
When mapping is done well, the output becomes reliable enough to publish.

Step-by-step workflow overview
I like to think of this as a two-phase pipeline:
Data phase (Teable): import CSVs, connect them into tables, enrich missing fields, and normalize messy formats (like URLs).
Presentation phase (Shareables): connect to a chosen table, pick fields, design a template (cards, details pages, filters), and embed or publish.
Below is a more detailed, practical checklist for each phase.
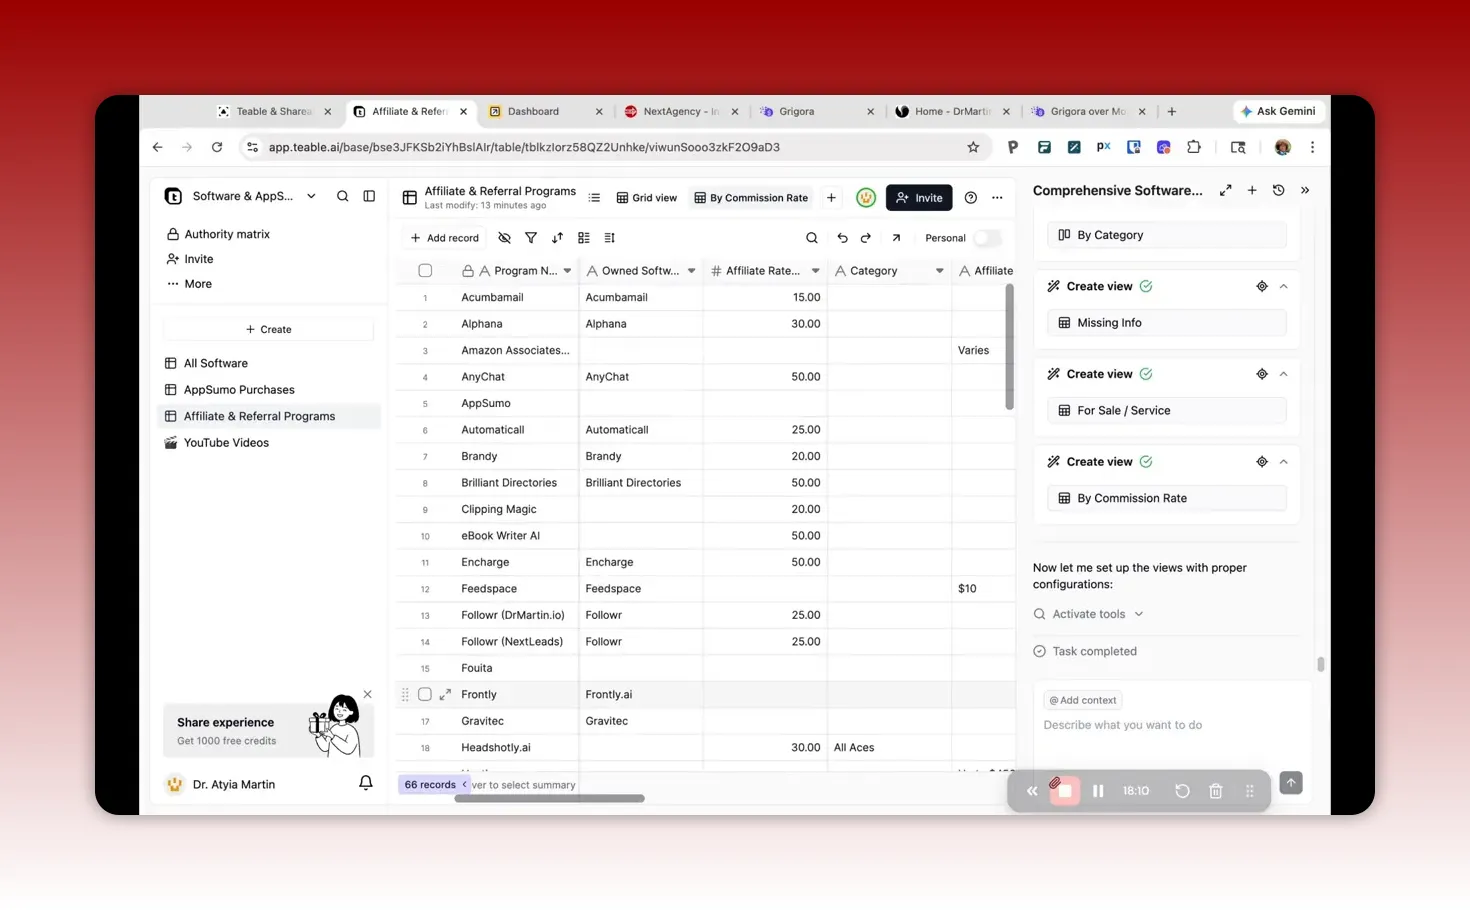
Phase 1: Turn disconnected CSV files into a relational database with Teable
1) Prepare your CSVs so AI can reason about them
You do not need perfect data, but you do need enough structure for mapping.
Use consistent column headers across files when possible.
Include stable identifiers (for example, a tool name, SKU, affiliate program name, or unique URL slug).
Keep each file focused on a single record type (avoid mixing unrelated entities).
My rule: if you cannot explain the meaning of each column to a teammate in one sentence, it is hard for automation to map correctly.
2) Create an “AI instructions” prompt that defines the relationships
Teable can generate relational outputs when you provide clear guidance on:
How many files are involved
What tables should be created
How the tables relate (matching keys or mapping logic)
What fields to enhance or fill
Any transformations (like building normalized link formats)
In my setup, I requested multiple tables plus relationships and also asked for enrichment and cleanup in columns that were inconsistent.
3) Validate the relational links before doing UI work
This is the biggest time saver. When relationships are wrong, everything downstream becomes confusing.
Validation checks I recommend:
Spot-check non-related entries to confirm they did not accidentally link.
Check URLs are correctly normalized (for example, full URLs instead of relative paths).
Confirm categorical fields are populated for the majority of records you care about.
Verify program-to-software matches for affiliate/referral style relationships.
In my own workflow, I paid special attention to affiliate and referral mappings because incorrect links can lead to broken monetization or misleading content.
4) Ask AI to enrich missing fields, but constrain it to what you want
A helpful approach is to specify:
Fields to add (for example, software description, category, purpose, normalized login link)
Fields to fix (for example, URL formatting)
Fields to update only if they are clearly wrong (to avoid unintended overwrites)
This is where AI adds real leverage. Instead of manually editing thousands of rows, you can let AI fill and standardize fields, then you correct the edge cases.
5) Treat URL normalization as a first-class task
One of the most practical improvements I saw was the cleanup of link formatting, including making sure affiliate and product URLs align with the correct software record. That reduces broken buttons, missing images, and mismatched detail pages later.
When URLs matter, insist that the process output:
Uses full URLs (not relative paths)
Removes stray prefixes or label text from pasted links
Targets the right destination (for example, login page vs homepage)
Phase 2: Publish an interactive widget with Shareables
1) Choose the data table that drives the widget
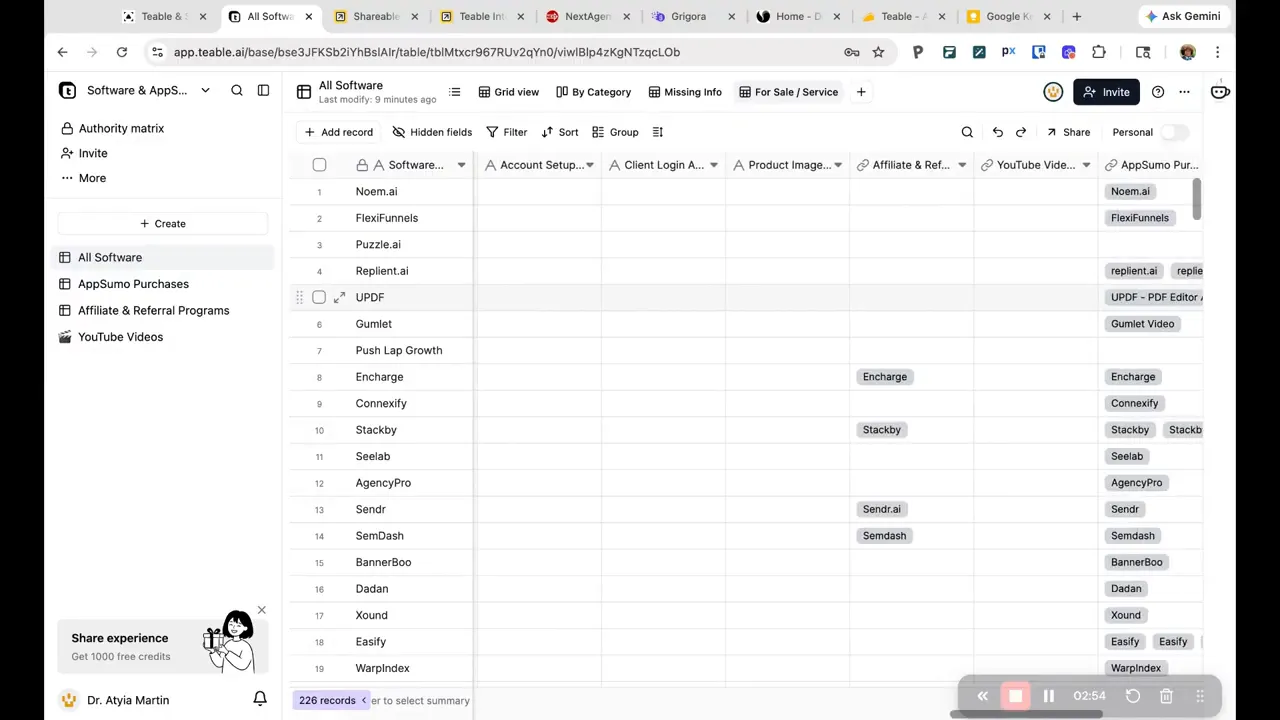
Shareables works best when there is a clear “main list” table. For example, if you want a directory of tools, select the Software table as the primary content list.
In my setup, I connected a library widget to a table that represented my primary “items.” That enabled details pages per item and consistent filtering.
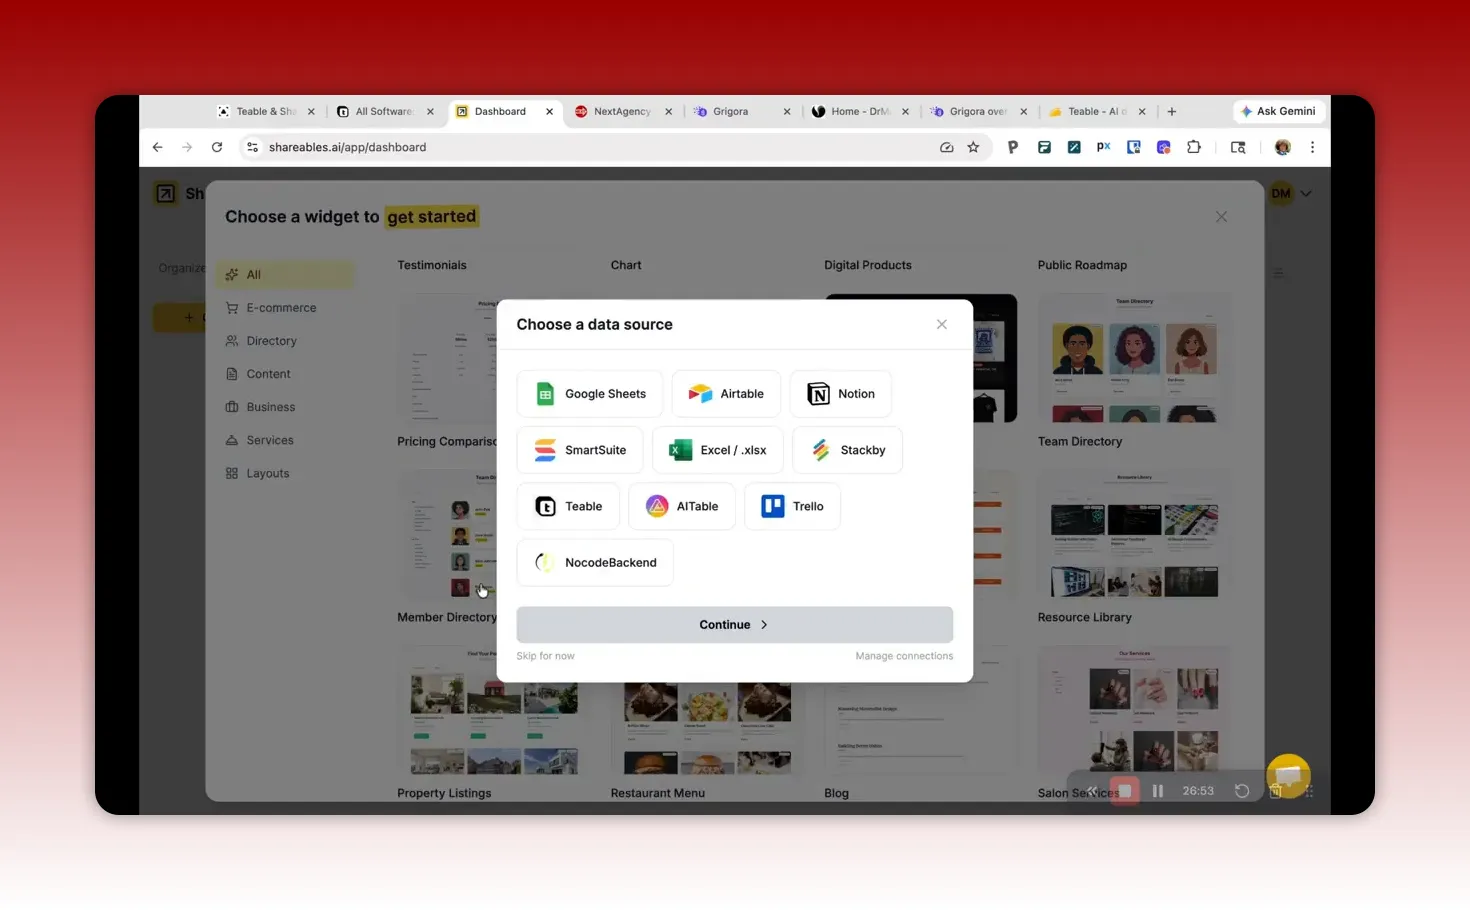
2) Connect Shareables to Teable using an access token
You will need to create an access token with sufficient permissions to read your structured data. The key is to ensure the token includes permissions for:
Reading tables and fields
Updating if your workflow adds or changes columns
Any additional scopes required by the integration
Common mistake: if permissions are too limited, field refreshes and widget updates can fail silently or produce empty values.
3) Pick fields intentionally (do not include everything)
When configuring a widget or template, map only the fields you want to appear.
Good field choices for an interactive directory usually include:
Title (name)
Description (short and/or expanded)
Cover or thumbnail image (image URL)
Badges (category, purpose, status such as “for sale”)
Details link identifiers (slug or item key)
Filters (one or more categorical fields)
4) Enrich images for better UX
Images matter. Without them, the directory feels unfinished and users do not engage as much.
In my workflow, my initial data had no product image URLs in the expected field, so Shareables did not automatically find or display images. The fix was to have Teable fill an images column by finding product image links and normalizing them into usable URLs.
After that, I reconnected and refreshed the widget settings so the UI could use the newly populated image field.
5) Build a template for list items and a details page
A strong interactive pattern usually includes:
List view cards with cover image, title, badges, and a short description
Details page per item with a longer description and deeper metadata
Related resources or “other items” suggestions to help navigation
I recommend designing with clear content hierarchy:
Top: image and title
Middle: description
Bottom: badges, filters, and a primary action (like “Access resources”)
6) Connect the details page URL slug properly
Details pages often rely on a “slug” or path field. If that slug is not derived correctly, users may see broken links or the wrong details content.
In my setup, I used the software name portion from the URL path and aligned it with the Shareables details page configuration. This ensured “Read More” opened the correct record details.
7) Configure filters so visitors can narrow results
Filters make the widget useful. Without them, the page becomes a static list that forces manual scanning.
Choose filters based on the way you expect people to search mentally, such as:
Category (for example, Finance, Productivity, Design)
Purpose (for example, Reselling, Internal use, Customer-facing)
Status (for example, Active company)
Then map each filter to the relevant field in your Teable table.
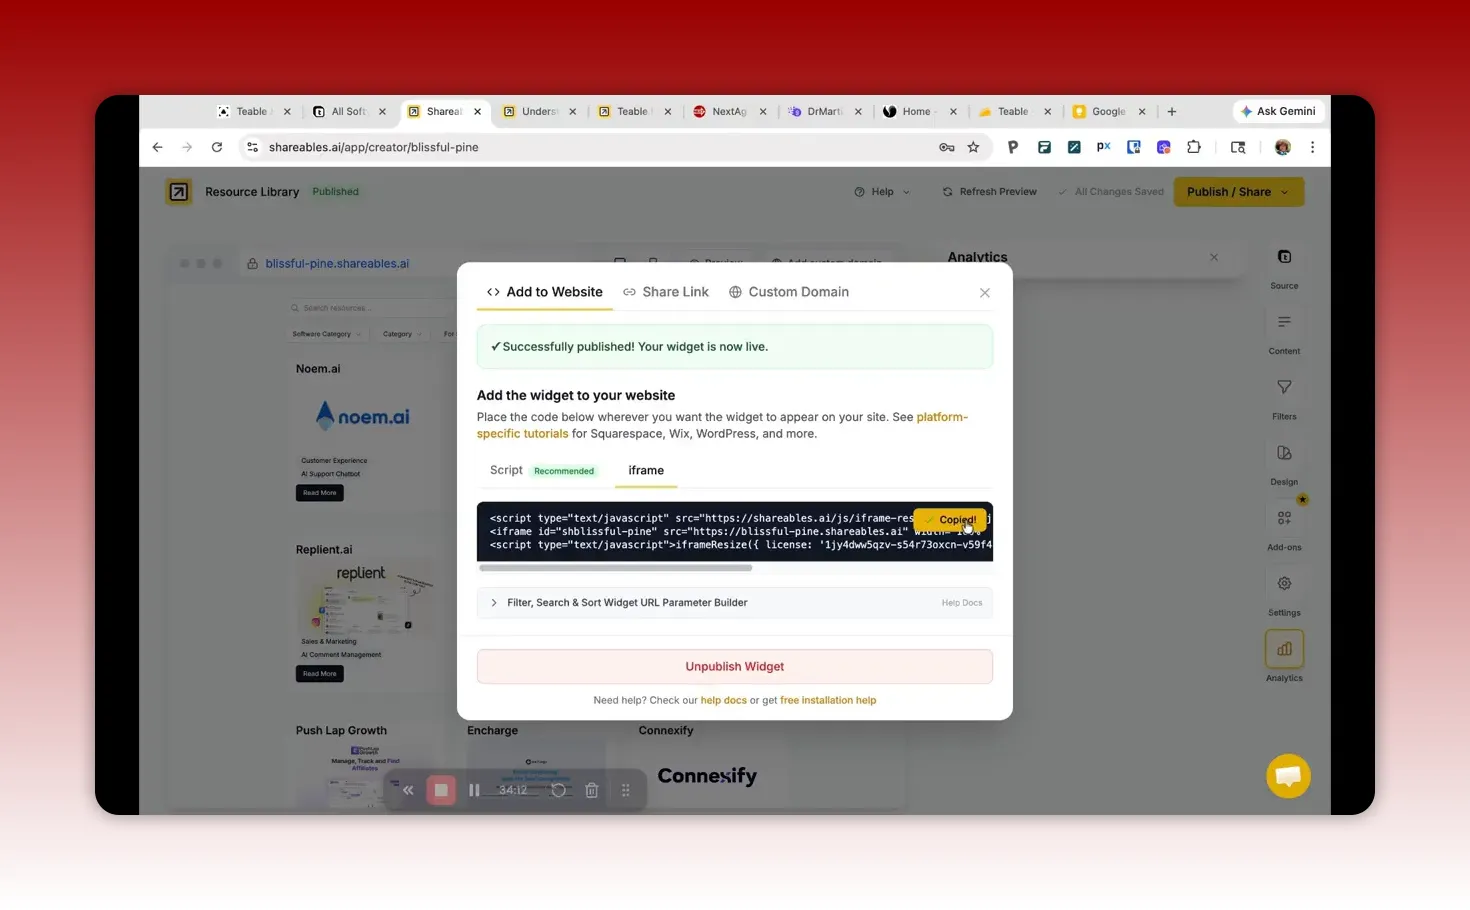
8) Publish and embed in your website
Once the widget looks correct:
Publish the Shareables page
Retrieve the embed code (iframe or equivalent)
Insert it into your website page
After embedding, do a quick end-to-end test:
Open multiple items
Verify images render
Confirm filters update results without blank states
Check that “Read more” and action buttons link correctly
Credits, scaling, and planning for real projects
AI-enhanced data transformation is powerful, but it is not free in terms of usage limits. In my setup with real data, the enrichment and structuring work consumed thousands of credits. That is consistent with the idea that AI will examine and process many records and fields, especially when filling images or normalizing URLs.
To plan for scaling:
Start with a smaller subset of your CSVs to validate relationships and field mapping.
Iterate fields in batches (first structure and relationships, then enrichment, then images).
Decide what “good enough” means before you enrich everything. Publishing prematurely can lead to wasted cycles.
Also consider the operational pattern:
Your widget should be driven by a stable primary table.
Updates should be incremental when possible (refresh only what changed).
Correct your mapping once, then reuse the same template logic.
Pitfalls and common mistakes to avoid
1) Adding new columns after connecting can require refreshes
If you update Teable by creating or populating a new field (like product images), Shareables may not automatically reflect the change. Plan for:
Refreshing the widget data source connection
Re-selecting the field in the template configuration
2) “Empty” template fields create blank UI sections
If a template expects a field but the data source does not provide values, that section may appear blank or missing. The fix is to either:
Select the correct data field for that UI component, or
Populate the missing field in Teable and refresh
3) Misaligned identifiers break relationships and details pages
The most common relational failure is when the “key” differs in spelling, casing, or formatting across CSVs. You can mitigate this by:
Using a standardized identifier column
Normalizing names before import
Checking relational links on a sample of records
4) Images and URLs are often the most fragile fields
Images usually require careful cleanup. If your image field contains relative paths or incorrectly formatted URLs, the UI can fail to render images. Prioritize normalization and validation.
5) Overbuilding templates before the data model is stable
It is tempting to design the UI early, but if the underlying data is not stable, you will rebuild configuration repeatedly. I recommend validating the relational model first, then designing the template.
Practical use cases: what people build with this pattern
1) Software directory and tool library
A directory is often the highest ROI because it turns internal research into reusable public-facing content. Typical sections include:
Tool cards with badges and images
Details pages with descriptions and metadata
Filters by category and purpose
Action buttons (for example, “Access resources”)
This is especially powerful when you also connect affiliate or purchasing metadata to the same records.
2) Program inventory for nonprofits
Some orgs maintain program lists across documents and spreadsheets. With a relational model, you can connect:
Program types
Service availability
Eligibility rules
Contact resources
The widget becomes a decision-support layer rather than a static list.
3) Knowledge base for internal operations
When you embed interactive resources into internal pages, staff can filter and find the right process or reference quickly. This is a measurable productivity gain compared to searching through spreadsheets.
Optimization checklist before you publish
Use this checklist as your “publish readiness” gate.
Relational links validated on at least 10 random records
URLs normalized (no relative paths, correct destinations)
Descriptions populated for the majority of items
Images populated and render correctly in list and details views
Badges map correctly to the right categorical fields
Filters work (no empty states caused by unmapped data)
Details pages route correctly (slug or item key aligns)
Primary action buttons link correctly (resource links or affiliate links)
FAQ
Can I use this workflow if my CSV files have different column names?
Yes, but you need to map fields clearly. The most reliable approach is to ensure each file has at least one shared identifier concept (like a normalized tool name, ID, or URL slug). Then you can instruct the transformation to place enriched values into your target columns.
What is the most important field to get right?
The identifier that powers relationships and details routing. If the key does not match across datasets, links and navigation will be unreliable.
Why are some images missing in the widget?
Usually because the image URL field is empty, contains relative paths, or is not populated in Teable before Shareables refresh and template selection. Normalize image URLs and refresh the widget so Shareables can pull the updated image field.
Do I need to be a developer to build interactive widgets?
No. You can configure templates, fields, and filters through the UI. Basic HTML/CSS customization is optional if you want deeper design control.
How do I reduce the risk of wasting credits during AI enrichment?
Test with a smaller subset first, and enrich in stages. Validate structure and relationships before running expensive enrichment like image discovery and URL normalization across the full dataset.
Final takeaway
This workflow is effective because it separates concerns:
Teable turns disconnected CSVs into a relational, enriched data foundation.
Shareables turns that foundation into an interactive widget that your audience can filter and explore.
When I reflect on what makes the biggest difference, it comes down to disciplined field mapping and validation. Get the relationships and identifiers right, normalize URLs (especially for images), then build the UI template. After that, updating content becomes far less manual and far more repeatable.
Practical next step
Start by listing your record types (tables), identify the shared keys between datasets (relationships), and define the fields you want to show on the widget (presentation). Once that is clear, the AI-assisted transformation and publishing become much easier to control.
This article was created based on the video Make Your Data Useable with AI: Teable & Shareables Review.

